Topping the charts

Winkletter • 16 Jul 2026 •
I did a bit of work on my slide deck application. I’m shaping it little by little, more and more. Today I added a few simple chart types and made the deck structure editable. It has slide types for simple data charts:
- Venn diagrams
- pie charts
- line charts
- bar charts
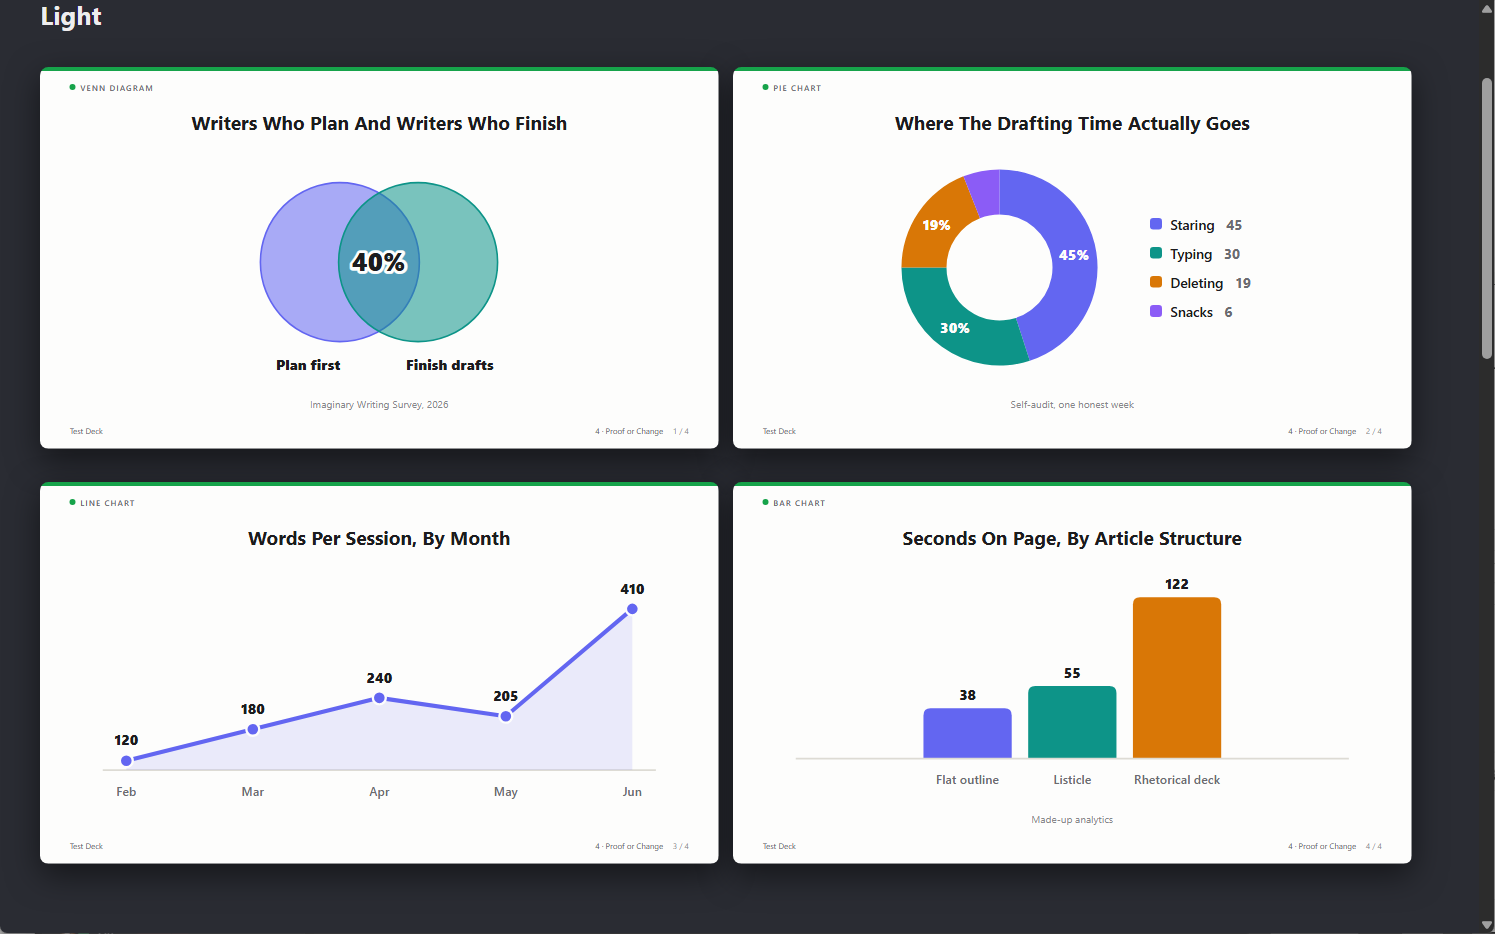
To add a chart I simply input the data into the form. No need to place anything. It just gets saved as data in the deck and the editor manages the layout.

The data is simple structured data. The program knows what kind of chart it is, so there’s no need for me to use an image editing program to make the diagram. The format is based on the slide type.
type: venn
section: 1
title: How Many Slide Decks Have Venn Diagrams?
left: Venn Diagrams
overlap: "15"
source: Made Up Data
right: Slide Decks
I also realized I was being overly restrictive with the structure of the deck, which is now editable. I think my next goal for this project is to figure out how to make videos with this system. Right now I can export PNGs and drop them into something like Google Vids, but I should be able to make my own video editor (with some AI assistance.)